History
The Onondaga Lake Watershed, with emphasis on Onondaga Lake, has had a well documented history of use and abuse. Variation in land use coupled with sites of known degradation (past and/or present) make the Onondaga Lake Watershed an ideal location to study the effects of land use and habitat quality on aquatic assemblages.
A. A History of Pollution
Nicknamed “Salt City,” Syracuse developed quickly as an industrial city in the late 19th and early 20th centuries, due in large part to the unique hydrogeology of the area. Brine springs in and around Onondaga Lake and salt beds in the Tully Valley (15 mi south of Syracuse) were tapped for commercial salt production (Kappel 2000). The commercialization of salt production in Syracuse brought economic and industrial prosperity, and with it, the rapid growth of the city. During that time, Onondaga Lake was quickly recognized for its recreational and commercial value. Numerous resorts and attractions around the lake and valuable fisheries such as the “Onondaga whitefish” (Coregonus spp.) drew in people from across the state. Prior to European settlement, Onondaga Lake was an oligo-mesotrophic lake that supported whitefish and Atlantic salmon fisheries (Ringler et al. 1996). As a result of the growth of the city of Syracuse and the expansion of the salt industry in the 20th century, Onondaga Lake and the surrounding watershed became fraught with pollution. Consequently, following more than a century of metropolitan and industrial wastes, Onondaga Lake was at one time considered one of the most polluted lakes in the United States (Effler 1996). In December 1994, Onondaga Lake was officially listed as a Superfund Site (United States Environmental Protection Agency (USEPA 2012).
The effects of pollution in Onondaga Lake became evident as early as 1901 when ice harvesting on the lake stopped. Swimming was deemed unsafe in 1940 and fishing was banned in 1970 (Hennigan, 1991). During this period, the lake experienced extensive algal growth, prolonged periods of hypolimnetic anoxia, and significant decreases in water clarity and quality. As a result, fish abundance and diversity decreased and the coldwater fishery was replaced by a more tolerant warm-water fishery. Ultimately, the lake was classified as a hypereutrophic system (Effler 1987, Henry et al. 1995).
1. Municipal and Domestic Pollution
The most notable source for the changes in water quality was the century-long contribution of municipal sewage flowing into the lake from the surrounding metropolitan area (Canale and Effler 1989). Efforts were made as early as 1907 to treat wastewater collected from the city with the creation of the Syracuse Intercepting Board (Effler and Hennigan 1996). The interceptor sewage system was completed in 1922. The sewage, however, was subsequently discharged to the lake following screening and disinfection. As part of this system, 120 combined sewer overflows (CSOs) were maintained. Storm water and untreated sewage were discharged to several tributaries and ultimately the lake when the total volume of effluent exceeded the capacity of the wastewater treatment plant. In 1925, a sewage treatment facility west of Onondaga Creek was completed. Effluent was discharged to the lake and the sludge was pumped to the Solvay Process wastebeds where it was mixed with industrial waste (Effler and Hennigan 1996). Additionally, a sewage treatment plant was built in 1936 that discharged wastewater to Ley Creek. The plant eventually closed in 1980. In 1960 the Syracuse Metropolitan Wastewater Treatment Facility (Metro) was constructed, with major upgrades to the plant occurring in the late 1970’s and early 1980’s. Tertiary treatment was added in 1981 as part of the facility’s upgrades to remove ammonia from the wastewater. During this time, Onondaga County also began separating sewers to limit overflows (Effler and Hennigan 1996).
Collectively, 49 Combined Sewer Overflows (CSOs) remain on Onondaga Creek, Ley Creek, and Harbor Brook that release storm and wastewater to the tributaries, and ultimately the lake, during periods of heavy precipitation (Rhea et al. 2006, Coon and Reddy 2008). Monitoring results show bacterial counts continue to increase following storm events (EcoLogic et al. 2010). The most recent results show that tributary monitoring sites in the middle and lower segment of Onondaga Creek and the lower segments of Harbor Brook and Ley Creek were in non-compliance for bacteria during October 2011 (OCDWEP 2011). CSO discharge from storm events, however, is not the only source of high bacteria concentrations in the tributaries. A recent examination of the Onondaga County water quality monitoring data has shown that dry weather discharges of bacteria, specifically in Onondaga Creek, are a major source of high bacteria concentrations and loadings (Onondaga Environmental Institute (OEI) 2010). High fecal coliform concentrations (≥ 200 colonies/100 mL) were observed 75% and 16% of dry weather days (precipitation < 1.3 mm/day in past two days) at Kirkpatrick St. and Dorwin Ave. (both urban sites), respectively, on an annual average basis between 2000 and 2006. Furthermore, a study of pathogens conducted by OEI in 2008 and 2009 found high bacteria concentrations in Harbor Brook and Onondaga Creek during dry weather conditions, as well as fluctuations in concentrations that could not be explained by CSO precipitation-driven discharges (OEI 2010). High concentrations of bacteria in the tributaries to Onondaga Lake, therefore, are not solely directed by heavy precipitation events, but a combination of sources that may include agricultural runoff, leaching septic systems, and the failing infrastructure of an aging sewer system in parts of the city.
2. Industrial Pollution
Industrial pollution and habitat loss also contributed to the progressive degradation of the lake and its tributaries, including Harbor Brook, Geddes Brook, Nine Mile Creek, and Ley Creek. The largest industrial input to the lake came from Solvay Process chemical manufacturing facility (later named Allied Signal and Allied Chemical Co., and now owned by Honeywell International Inc.1). During more than a century of operation (1884-1986), the western shore of the lake was inundated with more than 30 chemicals including insoluble sodium, calcium, and chloride waste generated from the soda ash production (sodium carbonate, Na2CO3) (Wagner 1998). The close proximity to the lake, in combination with the natural salt springs and limestone in the area, made Syracuse an ideal location for the soda ash facility. It was estimated that for every 1 kg of soda ash produced, 0.5 kg of NaCl and 1.0 kg of CaCl2 wastes were produced (Effler and Hennigan 1996). The waste slurry was composed of 5-10% suspended solids and was ultimately pumped to the western shore of Onondaga Lake. Prior to the early 1900’s, the waste was discharged directly to the lake (Effler and Hennigan 1996). The soluble portion of the slurry drained into the lake and Nine Mile Creek, and the suspended solids helped form what is now known as the wastebeds. The waste surrounds 30% of the lake shoreline and covers more than 8.1 km2, with the waste ranging from 2 to 21 m deep (Effler and Hennigan 1996). The southwest corner of the lake, which includes Harbor Brook, received multiple sources of waste over different time periods, resulting in an assortment of harmful pollutants leaching into groundwater, surface water, sediment, and ultimately Onondaga Lake. From 1898 to 1926, waste from Solvay Process was sent to what is now called Wastebed B, along the southwest shore of the lake. The Penn-Can Property, also part of Wastebed B, was historically used for the production and subsequent storage of asphalt products. From 1919-1978, that same location was used by Barrett Division of Allied Chemical to produce asphalt emulsions and coal tar-based products that were used in road construction. As a result of these operations, researchers have identified more than two dozen contaminants of concern at Wastebed B including: a dozen different metals, benzene, toluene, polycyclic aromatic hydrocarbons (PAH’s), polychlorinated biphenyls (PCBS), DDT, dieldrin, and polychlorinated dibenzodioxins/polychlorinated dibenzo-furans (PCDD/PCDF’s) (New York State Department of Environmental Conservation (NYSDEC) and USEPA, 2011).
The Allied Chemical soda ash facility closed in 1986, whereas the chlor-alkali facility remained in operation until 1979, when Linden Chemical and Plastics (LCP) purchased the facility (Wagner 1998, Atlantic States Legal Foundation (ASLF) 2009a). LCP remained in operation until 1988. The chlor-alkali facility (part of Allied Signal) produced chlorine gas and sodium hydroxide (Effler and Hennigan 1996). Mercury was used as a cathode and recirculated repeatedly during this process. During recirculation, mercury leaked or was discharged into Onondaga Lake via a drainage ditch. The West Flume has been identified as the primary source of mercury contamination in Onondaga Lake (ASLF 2009a). Mercury was released into the lake for 40 years (1946-1986). The USEPA (2006) estimated that the facility had discharged approximately 75,000 kg of mercury into the lake between 1946 and 1970. The close proximity of Nine Mile Creek and Geddes Brook (a tributary to Nine Mile Creek) to the LCP wetlands and Solvay wastebeds resulted in contamination by multiple pollutants. The primary contaminants of concern are mercury, arsenic, lead, hexachlorobenzene, phenol, PAH’s, PCBs, and PCDD/PCDF’s (NYSDEC and USEPA 2005). Allied Chemical also had a benzene production facility, known as the Willis Avenue Chlorobenzene Site, on its premises from 1918 to 1977. Waste, in the form of caustic potash (potassium hydroxide), caustic soda, and chlorine gas was discharged on-site and contamination of the lake occurred via groundwater seepage (Parsons 2012). Crucible Specialty Metals, near Allied Chemical, also contributed to the lake’s contamination, discharging substantial amounts of iron, chromium and copper to the lake. The former LCP site, Solvay wastebeds, Nine Mile Creek/Geddes Brook, and Willis Avenue Plant are all subsites of the Onondaga Lake Superfund site.
The Semet Tar Beds site is another source of contamination along the west shore of Onondaga Lake. From 1917-1970 the site was used as a depot for Semet material, which was an organic based material that resulted from acid washing processes used in coke light distillation (Parsons 2012). The primary contaminants of concern at this site are volatile organic compounds (VOCs) (USEPA 2011). Prior to 1917, the site, which consists of five irregularly shaped ponds, was used as a settling basin for Solvay Process waste (Wastebed A). Wastebed A was later excavated to create the Semet ponds. The ponds cover an area of approximately 4.5 hectares (ha) and have an estimated average depth of 6.1 meters (m). Approximately 80 million gallons of Semet material are estimated in the ponds, collectively (Parsons 2012). This site is a subsite of the Onondaga Lake Superfund site.
Industrial pollution has also been an issue in Ley Creek, which flows through a primarily urban and commercial landscape in the town of Salina. Industrial wastes were discharged to Ley Creek, including oils that contained PCBs, the primary contaminant of concern (ASLF 2009b). One known source for the pollution is the former General Motors Inland-Fisher Guide plant, which closed in 1993. In the 1970’s a portion of Ley Creek was dredged for the purpose of flood control. The contaminated sediment, or dredge spoils, from the dredging was placed along a 1,310 m section of the creek bank. Known as the Ley Creek Dredgings Site, PCB concentrations have been found as high as 466 parts per million (ppm) in the sediment and 10 parts per billion (ppb) in the groundwater (ASLF 2009b). Sediment containing PCBs greater than 50 ppm have since been removed from the site and taken to a hazardous waste landfill. Sediments containing less than 50 ppm PCBs were consolidated and covered with at least 12 inches of clean soil (ASLF 2009b). Some sediment in Ley Creek, however, remains contaminated with PCBs. In addition to industrial pollution, the Town of Salina Landfill, located near lower Ley Creek, has been a source of concern. During its operation, the landfill accepted domestic refuse and municipal solid waste. It also accepted hazardous wastes that included paint sludge and paint thinner, PCB-contaminated waste, and polluted sediment that had been dredged from Ley Creek (NYSDEC 2011). In 2007, the NYSDEC and USEPA developed a Record of Decision (ROD)2 to address issues associated with the landfill and develop methods for remediation of the site. The primary goal of the developed plan is to reduce human exposure to volatile organic compounds, polychlorinated biphenyls (PCBs), metals, and other contaminants that have leached into soil and groundwater (NYSDEC 2010). The closure of the landfill will include: excavating waste and contaminated sediment, sediment caps, groundwater treatment, engineered drainage and fencing, and long-term monitoring and maintenance (NYSDEC 2010). Lower Ley Creek and sites associated with Ley Creek (Salina Landfill, General Motors plant, and the Ley Creek Dredgings site) are considered subsites of the Onondaga Lake Superfund site (ASLF 2009b).
Another source of degradation to Ley Creek came via its tributary, Beartrap Creek. Beartrap Creek was historically classified as a trout stream in the 1950’s by the NYSDEC. It subsequently became polluted with the onset of increased urban development and Syracuse Hancock International Airport, which was constructed directly adjacent to Beartrap Creek. Runoff from the Airport’s deicing practices resulted in ethylene glycol contamination, causing increased algal blooms and degraded habitat quality in Beartrap Creek and contributing to degraded water quality in Ley Creek (Monostory 2009).
A total of 11 subsites, some of which have been previously discussed, have been identified as part of the Onondaga Lake Superfund site (Fig. 2). Two additional sites, Wastebeds 9-15 and the LCP Bridge St Operable Unit 2, are considered sites of concern and are being remediated by New York State.
3. Sedimentation
Sediment loading has also been a source of pollution for the Lake and several tributaries. Increased sedimentation reduces water clarity, degrades habitat, and negatively impacts aquatic biota (Allan 1995). Onondaga and Nine Mile Creeks are the greatest sources of sediment input to Onondaga Lake, contributing 61% and 28% of total suspended solids, respectively in 2009 (EcoLogic et al. 2010). The Tully Valley mudboils, which flow into Onondaga Creek, represent a natural phenomenon that has been documented as early as 1899 (Kappel and McPherson 1998). The mudboils are volcano-like cones of fine sediment caused by artesian pressure that pushes water to the surface. The discharge of sediment from these mudboils can last anywhere from several days to several years (Kappel and McPherson 1997, Speer 2010). The cones range from several inches to several feet high, and may be up to 30 feet in diameter. In 1991, the Tully Valley mudboils were determined by the Onondaga Lake Management Conference as the major source of turbidity to Onondaga Lake (Kappel and McPherson 1997). It was estimated that 30 tons of sediment per day entered Onondaga Creek in 1992 due to the mudboils. Efforts have since been made to slow mudboil activity including installing depressurizing wells and constructing an impoundment dam to contain sedimentation. Initially, efforts reduced the amount of the average daily load of sediment into Onondaga Creek substantially in 1993 and 1994 (Kappel and McPherson 1997). Eventually, however, the impounded area filled with sediment and several of the depressurizing wells became mudboils themselves. Subsequently, the amount of sediment discharged to the stream began to increase. In 2010, a mudboil became very active and began to flow directly into Onondaga Creek, discharging 15 tons of sediment per day (Speer 2010).
The channelization of the stream and reduced bank stability in the lower segment of Nine Mile Creek has undoubtedly contributed to the sediment load in the creek and Onondaga Lake. Fill deposits associated with road and bridge construction and waste soils from the wastebeds surround the creek (Parsons and Anchor QEA 2011). Investigation of sediment in the creek channel and floodplain showed that sediment in the creek consists of loose, silty sands and soft to stiff clays and the manmade fills, though diverse in type, are primarily loose (Parsons and Anchor QEA 2011). The lower segment of Nine Mile Creek and its tributary, Geddes Brook are a subsite of the Onondaga Lake Superfund site. Highlights of the current remediation plan for Nine Mile Creek include: to remove and manage sediment, place clean material throughout the site, improve channel stability and sinuosity, and develop long-term management and monitoring procedures (Parsons and Anchor QEA 2011).
B. Improving Conditions & Remediation
The Federal Clean Water Act (CWA) requires states to routinely assess and report on the quality of their waters. Specifically, section 303(d) of the CWA requires states to report impaired waterbodies. Impaired waters are defined as waters that do not support appropriate uses3 and that either require the development of a Total Maximum Daily Load (TMDL) or other restoration strategies to mitigate the input of pollutant(s) specific to a waterbody (NYSDEC 2012). Excluding Sawmill Creek, at least one segment from each of Onondaga Lake’s tributaries and the lake itself have been placed on the NYS 303(d) list for impaired waters (Table 1). Onondaga Lake had been placed on New York State’s 303(d) list in 1996 for exceeding water quality standards for ammonia and nitrite (Rhea et al. 2006). An Amendment Consent Judgment (ACJ) between Onondaga County, New York State, and Atlantic States Legal Foundation was signed in 1998 to resolve violations of the Clean Water Act as filed in a citizens’ lawsuit against Onondaga County (EcoLogic et al. 2010). Under the provisions set forth by the ACJ, the County is required to improve and monitor wastewater treatment and collection, including control and upgrade existing CSO’s and upgrade treatment and collection methods at the Metro facility.
For CSOs, the ACJ stated that the County’s program must: (1) eliminate or capture no less than 85% of combined sewage volume collected in the CSO system during precipitation events, on an annual basis; (2) eliminate or minimize the amount of floating debris into Onondaga Lake and; (3) achieve water quality standards for bacteria for all Class B waters4 in Onondaga Lake by 2012 (Amended Consent Judgment 1999). The ACJ has been recently amended to increase the capture or elimination of CSO volume to 89.5% by the end of 2013 and to 95% by the end of 2018 (OCDWEP 2011a). To meet the capture rate goal of 95% by 2018, a fourth stipulation has been added to ACJ to include the ‘Save the Rain’ program. Under this program, gray and green infrastructure has and is being implemented to help residents and businesses capture and use rainwater. Initiated in 2009 and scheduled to continue to 2018, the Save the Rain program will further reduce the amount of storm water runoff into CSO’s, thus helping Metro remain at or under capacity during heavy precipitation events (EcoLogic et al. 2010, OCDWEP 2011c). To date, four Floatables Control Facilities have been constructed to mitigate the amount of floating debris into Onondaga Lake (OCDWEP 2011a). In addition, the County employs the use of a skimmer boat to collect debris in the Onondaga Lake Inner Harbor, thereby satisfying the requirements of the floatable substances provision set forth in the ACJ.
Overall, efforts to reduce storm and wastewater runoff have had considerable effects on the concentration of fecal coliform bacteria in Onondaga Lake. From April to October of 2009, nine of 10 monitoring sites in the lake were in compliance with New York State fecal coliform bacteria concentrations, as designated for recreational use such as swimming. The sampling site adjacent to Onondaga Creek was in non-compliance 33% of the time in 2009 (EcoLogic et al. 2010). In 2010, eight of 10 sites were in compliance 100% of the time (April-October). Harbor Brook and the site adjacent to Onondaga Creek were in non-compliance 14% and 57% of the time, respectively, during sample months (OCDWEP 2011b). Sampling in 2011 revealed similar results to previous years, with fecal coliform bacteria in non-compliance at the sampling site adjacent to the Onondaga Creek outlet in November (OCDWEP 2011c). All sampling sites in waters designated Class B, however, were in compliance with the New York State standard for bacteria 2009-2011, thus meeting the obligations of the ACJ with regard to water quality standards for Class B waters in Onondaga Lake.
Improvements to the Metro facility have also had profound effects on the Onondaga Lake water quality. Historically, Metro contributed 90% of the total annual input of ammonia in the lake (EcoLogic 2006). New treatment technologies for ammonia became fully operational in 2004 and have since resulted in a 98% reduction of Metro’s ammonia loading to the lake (EcoLogic et al. 2010). Similarly, technologies for phosphorus reduction, which became operational in 2005, have resulted in an 86% decrease in phosphorus loading from Metro (EcoLogic et al. 2010). The watershed is now the greatest source for external phosphorus. In the summer of 2009, total phosphorous (TP) averaged 17 µg/l in the upper waters (EcoLogic et al. 2010). This was the second consecutive year that TP complied with the New York State guideline of 20 µg/l or less (NYSDEC 2008). In 2010, TP concentrations averaged 25 µg/l in the upper waters, a slight increase from the previous year (OCDWEP 2011b).
The recent reduction in external nutrient loading has led to a reduction in the amount and duration of algal blooms. In 1969, blue-green algae (Cyanophyta) were predominant in the lake (Meyer and Effler 1980). Blue-green algal blooms are often of concern to lake managers, as they are indicative of degraded water quality (EcoLogic 2006). By 1978, Meyer and Effler (1980) described a phytoplankton community completely devoid of blue-green algae. The loss of Cyanophyta was a direct response to the 1972 ban on phosphate detergents. Twenty years later, scientists found that blue-greens were again the dominant phytoplankton in both biomass and abundance in the lake (EcoLogic 2000). The durations of the blooms, however, were shorter in 1997 and 1998 than in 1996 (EcoLogic 2000). The percentage of blue-greens relative to the total phytoplankton in the lake has markedly decreased in the last decade. In the early 1990’s blue-greens represented over 50% of the total phytoplankton biomass. In 2005, they represented less than 2% (EcoLogic 2006). No algal blooms were documented in the lake in 2008 and 2009 (OCAMP Progress Report, 2010). This has resulted in considerable improvements in dissolved oxygen (DO) concentrations. The OLAMP reported fewer days of anoxia in the lake in 2005 than in years prior (EcoLogic 2006). Dissolved oxygen concentrations continued to improve, including a decrease in the number of volume-days5 of anoxia (<0.5 mg/l). Surface water DO concentrations have complied with regulatory standards during the critical fall mixing period since 2005 (EcoLogic et al. 2010). As a result of these improvements, the trophic status of Onondaga Lake has dramatically improved. Once considered a hypereutrophic system, Onondaga Lake is now in the mesotrophic range of productivity. This trophic status is now similar to surrounding lakes, such as Oneida Lake and several Finger Lakes (Onondaga Lake ACJ Compliance Program Monthly Report, 2011).
The increase in water clarity and dissolved oxygen in the upper waters have led to an increase in aquatic macrophyte beds and fish refugia. The eutrophic conditions of the lake in the early 1990’s noticeably hindered the macrophyte community, with only five species reported in 1991 (Madsen 1996). By 2005, 17 macrophyte species were found in the lake and percent cover has nearly tripled since 2000 (EcoLogic 2007). Not only has macrophyte diversity markedly increased, but plant distribution and biomass has increased as well. Within a decade, macrophyte coverage has increased from 34 hectares in 2000 to 166 hectares in 2010 (Onondaga Lake Fishery Fact Sheet 2011). A fish survey conducted in Onondaga Lake in 1969 found 16 species of fish (Noble and Forney 1971). Since 1987, surveys have documented 66 fish species in the lake at one time or another (Siniscal 2009). On average, surveys conducted by SUNY-ESF identify approximately 40 species annually.
The most recent data (EcoLogic et al. 2010) show that water quality continues to improve around the lake and that overall, the major tributaries were in compliance with New York State standards in 2009. Several sites, however, remained impaired, exceeding State water quality standards for certain parameters, and such trends appeared similar to previous years. Bloody Brook and Sawmill Creek were in compliance for all parameters in all sampling events. Ley Creek periodically exceeded water quality standards for cyanide in 2009. The lower segment of Nine Mile Creek, Harbor Brook, and Onondaga Creek exceeded water quality standards for pH6 4% of the time. The Dorwin Ave. site on Onondaga Creek (middle segment) also exceeded standards for pH and nitrite, with samples in non-compliance 2% and 3% of the time, respectively (EcoLogic et al. 2010). Compliance for bacteria remains problematic for tributary sites, with sites in non-compliance varying each month. The most recently available data, collected in January 2012, show Harbor Brook at Hiawatha Blvd., Bloody Brook at Onondaga Lake Parkway, and Ley Creek at Park St. to be in non-compliance (OCDWEP 2012).
In addition to continually improving lake conditions, a remediation plan designed by the New York State Department of Environmental Conservation has been approved and is underway in and around Onondaga Lake (Honeywell Inc. 2008). The cleanup is being addressed in two stages: (1) interim remedial measures (IRMs), and (2) long-term remedial actions (USEPA, 2011). IRMs included in the Onondaga Lake cleanup are: “removing chlorobenzene from existing wells; altering existing on-site sewers; on-site demolition, removal, decontamination and recycling of former mercury cell processing buildings and building materials; cleaning storm drainage systems; investigation of berms surrounding the Semet Tar Ponds; design and construction of a lakeshore barrier wall and groundwater collection/treatment system; and removal of some contaminated sediments and floodplain soils from Geddes Brook and the East Flume,” (USEPA 2012). The groundwater treatment plant in Geddes prevents contaminated groundwater from flowing into Onondaga Lake and was completed in 2006 (Honeywell 2006). The installation of a 2.4 km long and 13.7 m deep barrier wall along the southwest shore of the lake was completed in 2011 (Honeywell 2011). The barrier wall prevents contaminated groundwater from seeping into the lake. Additionally, the capping and dredging design for Onondaga Lake has been finalized and dredging began in April 2012 (Honeywell 2011). Under the plan, nearly 2.42 million cubic meters of soil in the lake will be dredged and 172 hectares of the lake bottom will be capped with sand, gravel and other material.
Between 1998 and 2010 eight RODs have been approved for cleanup efforts at various subsites. Remedies to be implemented at some or all the subsites include: dredging sediments, excavating soils, treatment of contaminated soils and materials (on and off site), treatment of contaminated groundwater, and capping excavated soils (USEPA 2012). Currently, the RODs are at various stages of planning, design, and implementation. Construction is underway at the Town of Salina Landfill to collect and remediate wastewater and hazardous materials (USEPA 2011). Remedial work (refer to p.6) at the Ley Creek PCB Dredgings site was completed in 2000. Most remedial activities at the LCP Bridge St. subsite were completed in 2007. Remediation at that site will be completed when remediation at the Nine Mile Creek/Geddes Brook subsite is completed. Work continues at the Willis Avenue subsite; approximately 40,000 gallons of chlorobenzene have already been removed to date (USEPA 2011).
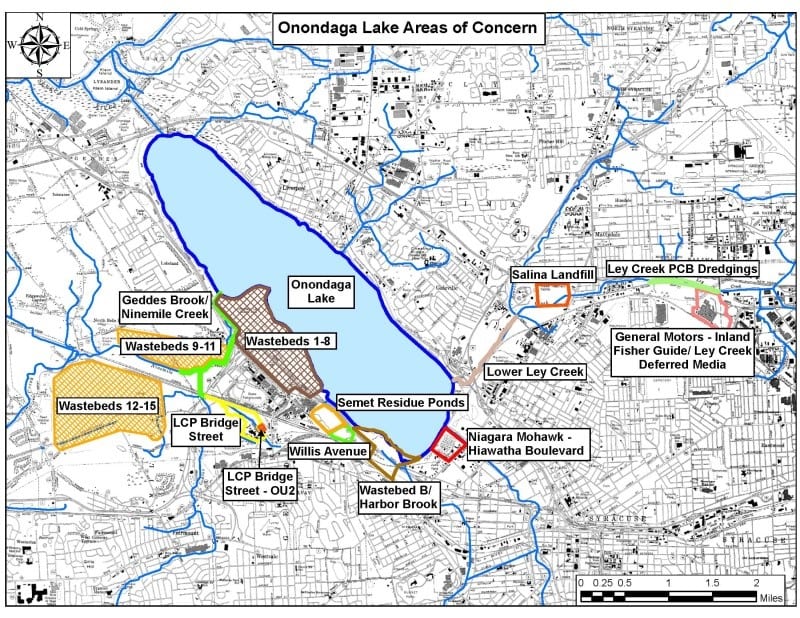
Figure 2. Subsites of the Onondaga Lake Superfund site. Source: NYSDEC, 2012 (www.dec.ny.gov).
1Honeywell is financially responsible for the Onondaga Lake clean-up, including upland sites that contributed to the pollution of Onondaga Lake and its tributaries.
2A Record of Decision (ROD) is a public document that outlines the methods that will be used to clean up a Superfund site (listed on the National Priorities List). The ROD is created from information collected during a Remedial Investigation/Feasibility Study (RI/FS) (www.epa.gov/superfund/cleanup/rod.htm).
3Surface water classifications, as defined in 6 NYCRR §701 (NYSDEC), are: Class A best usage – drinking supply; Class B best usage – primary and secondary contact (recreation and fishing); Class C best usage – fishing; Class C(T) – trout waters (i.e., capable of supporting trout based on water quality standards and thermal criteria); Class C(TS) – trout spawning waters; Class D best usage – fishing, though waters will not support fish propagation.
4In Onondaga Lake, Class B waters are northwest of an imaginary transect that extends from Tributary 5A on the west shore to just southeast of Bloody Brook on the east shore, excluding a 0.25 mi radius at the mouth of Nine Mile Creek, which is classified as Class C waters.
5Volume-days is one measurement that incorporates both the volume of water and the number of days affected by anoxia and hypoxia (EcoLogic et al., 2010).
6NYS water quality standards for pH in Class B and C waters “shall not be less than 6.5 nor more than 8.5” (NYSDEC 2012).